Ceres Solver の使い方2〜3次関数のフィッティング
引き続き Ceres Solver のサンプルです.前回の直線フィッティングより少し問題を複雑化して解いてみます.
3次関数のフィッティング
1.問題設定(3次関数のフィッティング)
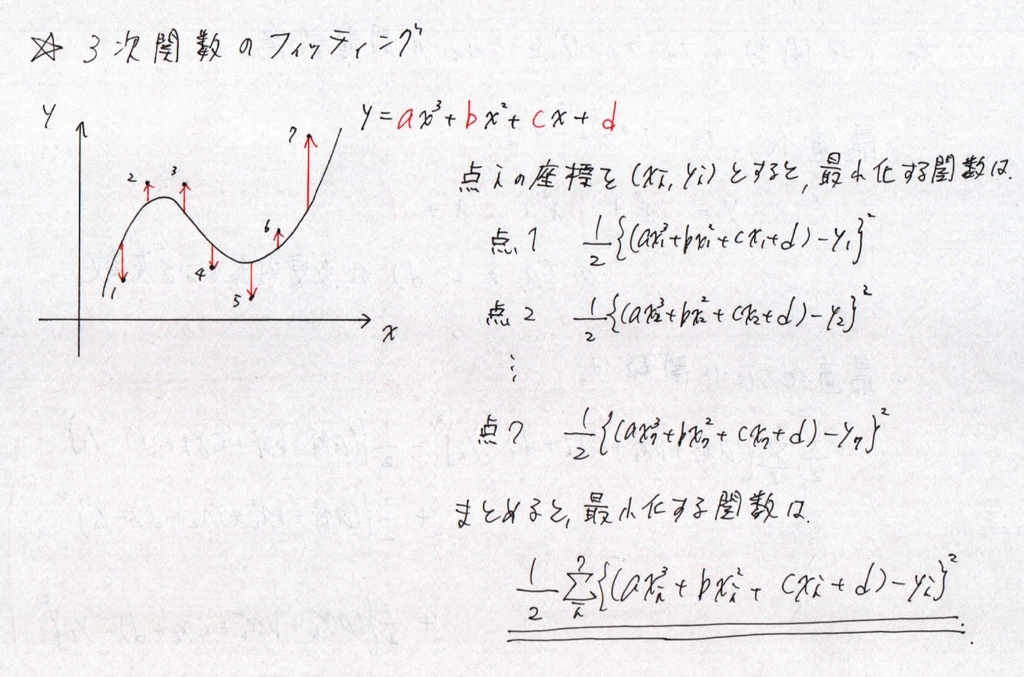
前回とほぼ同じですが,3次関数のフィッティングをやってみます.3次関数なので,推定するパラメータが2つ増えています.
問題設定は下記のとおりです.
2.3次関数のフィティングと Ceres の問題設定
ということで,前回のエントリでも書いた下記の2点を明確にします.
1. Ceres に調整してほしい変数は何か?
> 2次関数のパラメータ3つ.(a, b, c)
2. 調整対象となる変数によって,全体のコストがどう変わるか?
> 上図の一つ一つの Residual Block の総和が全体のコストを定義します.
3.直線のフィティングとの差分
直線のフィティング問題の時からの差分ですが,Ceres Solver のコードに直接的に関係する差分は下記の2点だけです.ほかは全く同じ用に問題を解けます.
コスト関数の差分
当然ながらコストを計算する関数が3次関数になっています.
struct CostFunctor {
  CostFunctor(double x, double y) : m_x(x), m_y(y) {}

  // コスト計算部を3次関数に.
  template <typename T> bool operator()(const T *const x, T *residual) const {
    T val = x[0] * std::pow(m_x, 3.0) + x[1] * std::pow(m_x, 2.0) + x[2] * m_x +
            x[3];
    residual[0] = val - m_y;
    return true;
  }

private:
  const double m_x;
  const double m_y;
};
CostFunctionのパラメータ設定
調整パラメータの数が2つから4つに増えているのでそれをテンプレートパラメータとして指定します.
    ceres::Problem problem;
    for (size_t i = 0; i < x_vec.size(); i++) {
      ceres::CostFunction *cost_function =
          new ceres::AutoDiffCostFunction<CostFunctor, 1, 4>(     // Residual の次元は1,調整パラメータは4つなので,4.
              new CostFunctor(x_vec[i], y_vec_noise[i]));
      problem.AddResidualBlock(cost_function, nullptr, co_est.data());
    }
4.実行結果
下記,実行結果です.matplotlib-cppを使って,c++からPythonを読んでます.下図の青い曲線がもともとの直線,点がノイズを含む点,そして緑の曲線が Ceres でフィティングした直線になります.
5.コード
一応全コードを下記に載せておきます.自分のGithubにも上げているので,何かの役に立てば...該当コードは curve_fitting2.cpp というコードです.
github.com
// Standard Lib
#include <iostream>
#include <random>

// STL
#include <algorithm>
#include <iterator>
#include <vector>

// Ceres
#include <ceres/ceres.h>
#include <glog/logging.h>

// Matplot Lib
#include <matplotlibcpp.h>

using namespace std;
namespace plt = matplotlibcpp;

template <typename T> struct CubicFunctor : public unary_function<T, T> {
  CubicFunctor(vector<double> &c) : m_c(c) {}
  T operator()(T x) {
    T x3 = x * x * x;
    T x2 = x * x;
    T x1 = x;
    return m_c[0] * x3 + m_c[1] * x2 + m_c[2] * x1 + m_c[3];
  }

private:
  vector<T> m_c;
};

template <typename T> struct NoiseAddingFunctor : public unary_function<T, T> {
  NoiseAddingFunctor(T mean, T stdv) : engine(), dist(mean, stdv) {}
  T operator()(T x) { return x + dist(engine); }

private:
  default_random_engine engine;
  normal_distribution<> dist;
};

struct CostFunctor {
  CostFunctor(double x, double y) : m_x(x), m_y(y) {}

  template <typename T> bool operator()(const T *const x, T *residual) const {
    T val = x[0] * std::pow(m_x, 3.0) + x[1] * std::pow(m_x, 2.0) + x[2] * m_x +
            x[3];
    residual[0] = val - m_y;
    return true;
  }

private:
  const double m_x;
  const double m_y;
};

int main(int argc, char **argv) {
  std::cout << __FILE__ << std::endl;
  google::InitGoogleLogging(argv[0]);

  // 1. Setting Up Sample Points.
  double minx = -5.0, maxx = 5.0, reso = 0.1;
  int num = (maxx - minx) / reso + 1;
  // Determine Coefficient
  vector<double> coeff{0.5, -0.5, -10.5, 1.0};

  // Create X Vector
  vector<double> x_vec(num, 0.0);
  iota(x_vec.begin(), x_vec.end(), 0.0);
  transform(x_vec.begin(), x_vec.end(), x_vec.begin(),
            [minx, reso](double val) { return val * reso + minx; });

  // Create Y Vector
  vector<double> y_vec(num, 0.0);
  transform(x_vec.begin(), x_vec.end(), y_vec.begin(),
            CubicFunctor<double>(coeff));

  // Create Noised Y Vector
  vector<double> y_vec_noise(num, 0.0);
  transform(y_vec.begin(), y_vec.end(), y_vec_noise.begin(),
            NoiseAddingFunctor<double>(0.0, 5.0));

  // 2. Create Ceres Problem
  vector<double> co_est(4, 0.0);
  std::vector<double> y_est(x_vec);
  {
    ceres::Problem problem;
    for (size_t i = 0; i < x_vec.size(); i++) {
      ceres::CostFunction *cost_function =
          new ceres::AutoDiffCostFunction<CostFunctor, 1, 4>(
              new CostFunctor(x_vec[i], y_vec_noise[i]));
      problem.AddResidualBlock(cost_function, nullptr, co_est.data());
    }

    // Run the solver!
    ceres::Solver::Options options;
    options.minimizer_progress_to_stdout = true;
    ceres::Solver::Summary summary;
    ceres::Solve(options, &problem, &summary);

    // Status Report!
    std::cout << summary.BriefReport() << std::endl;

    std::cout << "Original Parameters" << std::endl;
    {
      ostream_iterator<double> out(std::cout, ", ");
      copy(coeff.begin(), coeff.end(), out);
      std::cout << std::endl << std::flush;
    }

    std::cout << "Estimated Parameters" << std::endl;
    {
      ostream_iterator<double> out(std::cout, ", ");
      copy(coeff.begin(), coeff.end(), out);
      std::cout << std::endl << std::flush;
    }

    // Generate Point on Estimated Curve.
    transform(x_vec.begin(), x_vec.end(), y_est.begin(),
              CubicFunctor<double>(co_est));
  }

  // 3. Plot Result
  {
    plt::xlim(minx - 5, maxx + 5);

    plt::plot(x_vec, y_vec);
    plt::title("Orignal vs Estimated");
    plt::scatter(x_vec, y_vec_noise);
    plt::plot(x_vec, y_est);

    plt::show();
  }

  return 0;
}